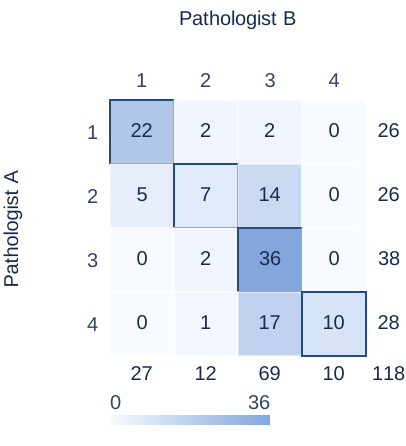
 1 Negative · 2 Atypical hyperplasia · 3 Carcinoma in situ · 4 Invasive carcinoma
Pathologists grading cervical slides
Two pathologists classify 118 slides into four ordered categories.
Paste two raters' labels or an agreement table to measure agreement beyond chance.
| Select | Name | Role |
|---|---|---|
| Pathologist A | ||
| Pathologist B |
Weighted kappa uses this category order.
Your data stay in this browser.
95% CI [.71, .86]
Substantial agreement · Landis & Koch 1977
Unweighted κ = .49 [.38, .60]
n = 118
| Weighted κ (quadratic) | .78 |
|---|---|
| Confidence interval | .71, .86 |
| Unweighted κ | .49 |
| Unweighted κ Confidence interval | .38, .60 |
| Percent agreement | 63.56% |
| Chance agreement | 28.12% |
| Standard error | .04 |
| z | 8.61 |
| p value | < .001 |
| Maximum kappa | .62 |
| PABAK | .51 |
| Gwet’s AC1 | .53 |
| AC1 CI | .41, .64 |
| Category | Rater 1 n | Rater 2 n | Specific agreement |
|---|---|---|---|
| Negative | 26 | 27 | .83 |
| Atypical hyperplasia | 26 | 12 | .37 |
| Carcinoma in situ | 38 | 69 | .67 |
| Invasive carcinoma | 28 | 10 | .53 |
| ID | Pathologist A | Pathologist B |
|---|---|---|
| 1 | Invasive carcinoma | Carcinoma in situ |
| 9 | Atypical hyperplasia | Carcinoma in situ |
| 12 | Atypical hyperplasia | Carcinoma in situ |
| 13 | Invasive carcinoma | Carcinoma in situ |
| 14 | Negative | Atypical hyperplasia |
| 17 | Atypical hyperplasia | Negative |
| 20 | Atypical hyperplasia | Carcinoma in situ |
| 21 | Invasive carcinoma | Carcinoma in situ |
| 23 | Atypical hyperplasia | Negative |
| 24 | Atypical hyperplasia | Carcinoma in situ |
Two raters agreed on 63.6% of 118 records (quadratic-weighted Cohen's κ = .78, 95% CI [.71, .86]), indicating substantial agreement (Landis & Koch, 1977). Unweighted κ = .49.
Start with a dataset similar to yours.
1 Negative · 2 Atypical hyperplasia · 3 Carcinoma in situ · 4 Invasive carcinomaTwo pathologists classify 118 slides into four ordered categories.
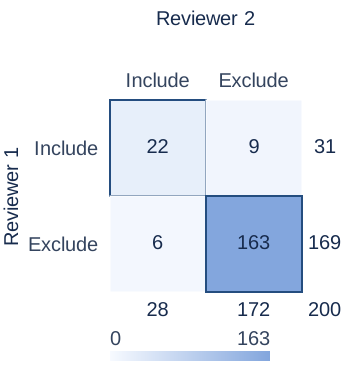
Compare inclusion decisions and inspect disagreements.
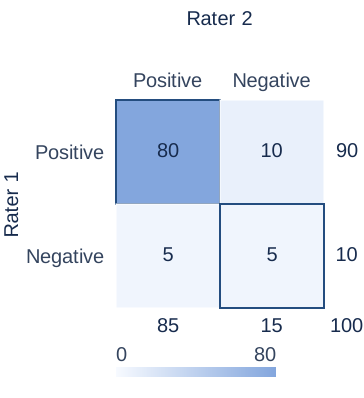
Examine the effect of unbalanced categories.
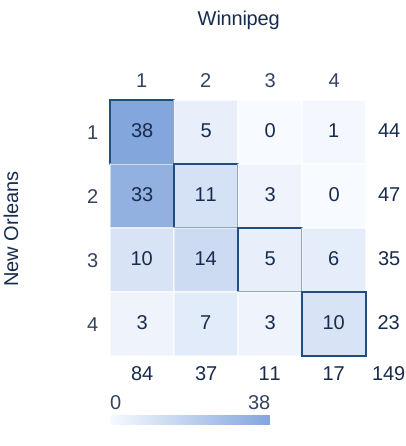 1 Certain · 2 Probable · 3 Possible · 4 Doubtful
Compare ordered diagnoses for patients in Winnipeg.
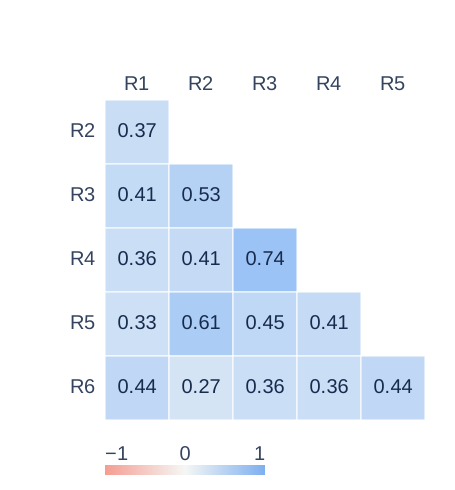 R1–R6 = Rater 1–6
Fleiss reported category counts for changing raters; the fixed-rater columns here are simulated.
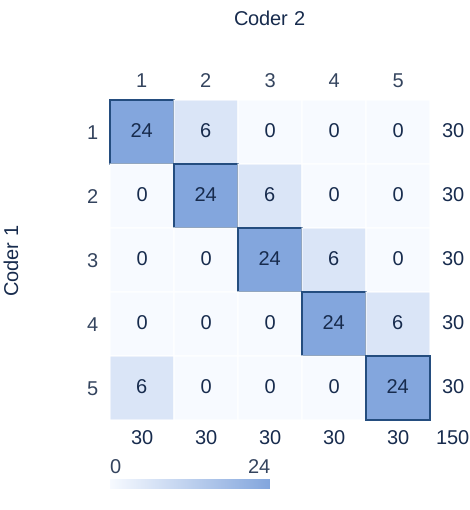 1 Access · 2 Cost · 3 Trust · 4 Workload · 5 Other
Compare five nominal codes across interview segments.
Go from ratings to a report-ready result in four steps.
Paste two or more columns, or enter a square table.
Choose the rater columns and move ordered categories into place.
Select the weighting method and confidence level.
Download a figure or copy your report sentence.
Kappa compares observed agreement with agreement expected from the raters’ category frequencies. Interpretation depends on the task and the consequences of disagreement.
| κ range | Landis & Koch 1977 | McHugh 2012 |
|---|---|---|
| < 0 | Poor agreement | — |
| 0–.20 | Slight agreement | None |
| .21–.39 | Fair agreement | Minimal |
| .40 | Fair agreement | Weak |
| .41–.59 | Moderate agreement | Weak |
| .60 | Moderate agreement | Moderate |
| .61–.79 | Substantial agreement | Moderate |
| .80 | Substantial agreement | Strong |
| .81–.90 | Almost perfect agreement | Strong |
| > .90–1 | Almost perfect agreement | Almost perfect |
The same 85% agreement can yield different kappa values when the category distributions differ. Examine prevalence and report PABAK or AC1 alongside kappa.
κ = .70 · PI = −.05
κ = .32 · PI = .75
Both examples: 85% agreement · PABAK = .70
Linear weights treat each step of disagreement equally; quadratic weights penalize larger differences more strongly. Choose weights before analysis and verify the category order.
| 1.00 | 0.67 | 0.33 | 0.00 |
| 0.67 | 1.00 | 0.67 | 0.33 |
| 0.33 | 0.67 | 1.00 | 0.67 |
| 0.00 | 0.33 | 0.67 | 1.00 |
| 1.00 | 0.89 | 0.56 | 0.00 |
| 0.89 | 1.00 | 0.89 | 0.56 |
| 0.56 | 0.89 | 1.00 | 0.89 |
| 0.00 | 0.56 | 0.89 | 1.00 |
References: Landis & Koch (1977) · McHugh (2012) · Feinstein & Cicchetti (1990)
Observed agreement is pₒ and expected agreement from the marginal proportions is pₑ. Weighted kappa applies agreement weights to each cell; Fleiss kappa extends agreement to multiple ratings per subject.
For the default data, pₒ = 75/118, pₑ = .281, and κ = .493.
References: Cohen (1960) · Cohen (1968) · Fleiss, Cohen & Everitt (1969) · Fleiss (1971)
Cohen’s kappa measures agreement between two raters after accounting for agreement expected by chance. A value of 1 is perfect, 0 equals chance and a negative value is below chance. For internal consistency of questionnaire items, use the Cronbach’s alpha calculator.
There is no universal cutoff. Landis and Koch describe .61–.80 as substantial agreement, but the context and consequences of disagreement matter.
An imbalance in categories can make expected chance agreement high, reducing kappa even when observed agreement is high. Consider reporting PABAK and AC1 as well. If one rater is a reference standard, consider the sensitivity and specificity calculator.
Use weighted kappa for ordered categories when some disagreements are more serious than others. Select linear or quadratic weights before analysis.
Use Fleiss’ kappa for categorical ratings with a fixed number of ratings per subject from three or more raters. Krippendorff’s alpha supports a broader range of missing-data designs.
Use kappa for categorical ratings and consider an intraclass correlation coefficient (ICC) for continuous measurements.
The calculator uses a large-sample standard error for Cohen’s kappa and a subject-level variance with a t distribution for Fleiss’ kappa.
Yes. SPSS provides kappa in Crosstabs; R packages including irr, psych and vcd also calculate agreement statistics.
Report the coefficient, confidence interval, sample size, number of raters, weighting method when used, and the observed agreement.